guidelines to charting your fertility cycle, page 8 of 26
1. The Temperature Method - How To Interpret A Chart (C):
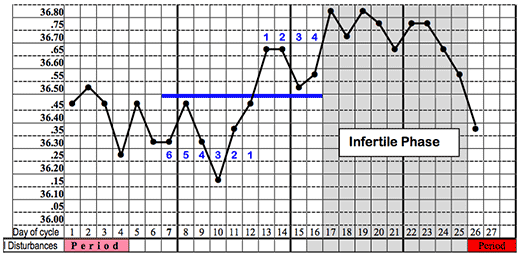
The completed chart below shows how well the rules work. The temperature stabilised later, as expected, and it finished as a 25 day cycle. Day 26 is the start of the period and becomes Day 1 of a new chart. As already explained, infertility continues from the night of the 4th high temperature in this chart (Day 16) until the period starts (provided it is double-checked by mucus rules)

In hindsight, Day 15 was obviously infertile and so this rule added on a day’s extra waiting. But for those with serious reasons for avoiding pregnancy, it is a wise rule to follow due to an insecure rise.
please note that temperature levels vary in different people. the charts given are just examples. your temperature may be lower than the examples, or higher. occasionally some people’s readings drop below the chart! if this happens regularly, you may need to re-write the readings on the side of the chart to fit your own personal range. however, the rules for interpretation remain the same.
- Previous |
- Next |
- Exit Tutorial |
- Help |
- Download as a PDF
© 2011 Fertility Education & Training