guidelines to charting your fertility cycle, page 7 of 26
1. The Temperature Method - How To Interpret A Chart (B):
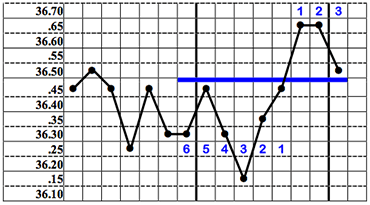
The majority of temperature charts follow the previous rule. However, in about 20% of charts, the temperature rise is more erratic and an additional rule is needed for security, if the 3rd high reading does not achieve a rise of 0.2°C above the cover line, as shown below.


You need to be more cautious with this chart. The 3rd high temperature is just above the line, but doesn’t give you confidence at this stage. Could it go down tomorrow? Are days 13 and 14 unrecognised disturbances? These are questions that go through your mind.
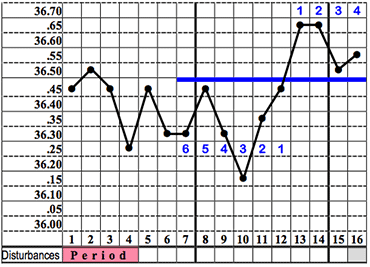
So, to avoid mistakes in this situation, the method rule says: wait for one extra reading to confirm what is happening.
The extra reading only has to be above the cover line for the rest of the cycle to be considered absolutely infertile.
Once you have 4 readings higher than the preceding 6 low readings, this is good proof of a temperature shift.
Infertility begins on the evening of the 4th high temperature (Day 16 in this example) (provdided it is double-checked by Mucus Rules which follow later in this Tutorial)
- Previous |
- Next |
- Exit Tutorial |
- Help |
- Download as a PDF
© 2011 Fertility Education & Training