understanding your fertility, page 13 of 14
The Temperature Indicator in Natural Family Planning
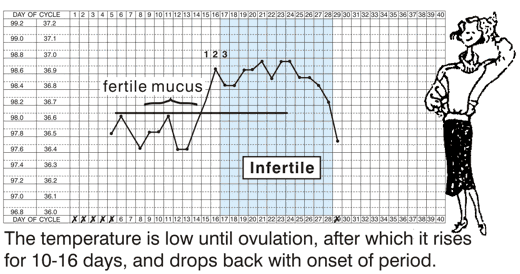
Normal body temperature levels vary in different women. But whatever the level, there will be a sustained rise after ovulation due to the effects of Progesterone.

The top chart shows how the temperature stays at a lower level until ovulation.
After ovulation, it rises to a higher level (about 0.3°C).
It falls back to the low level 10 - 16 days later, and the period starts.

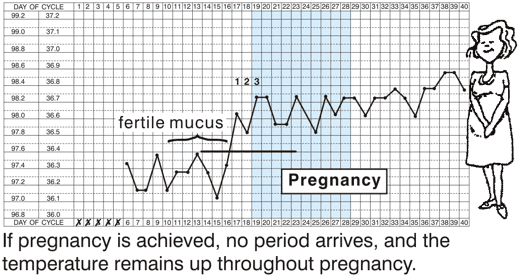
If pregnancy is achieved (lower illustration), the temperature remains up (for 9 months in fact).
to make this method work
The temperature must be taken:
- before getting out of bed in the morning
- at the same time each day
- the readings must be recorded on a special chart. (See Guidelines Booklet)
statistical success of the temperature method
When a temperature chart is properly kept and 3 genuinely raised temperatures have been recorded, the rest of the cycle is infertile, with the same surprise pregnancy rate as female sterilisation - that is, virtually zero.
limitations of the temperature method
- It gives no warning of when fertility begins.
- It only confirms when ovulation is over.
- Body temperature can be disturbed by various factors, illness, alcohol, oversleeping etc. (See Guidelines Booklet)
It was not until the 1960’s that the mucus symptom was understood and publicised by Drs. Evelyn and John Billings. It came to be included in temperature charting to give a combined double-check approach.
This combined approach, called the sympto-thermal method, is the approach preferred by Fertility Education & Training.
- Previous |
- Next |
- Exit Tutorial |
- Help |
- Download as a PDF
© 2011 Fertility Education & Training