guidelines to charting your fertility cycle, page 6 of 26
1. The Temperature Method - How To Interpret A Chart (A):

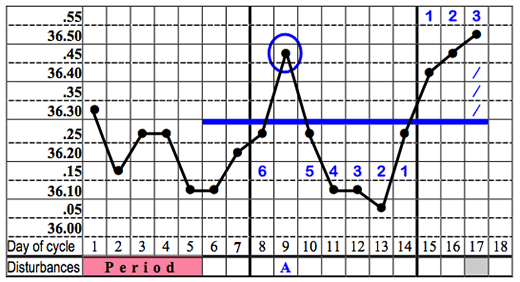
- When 3 readings (Days 15, 16, 17 in this example) have risen above the preceding 6 temperatures, and they are not disturbances, draw a cover-line immediately above the last 6 low readings (excluding disturbances) and number them back 1-6, as illustrated. This establishes a visual dividing line (the blue line) between the low and the high readings.
- Number the raised readings 1, 2, 3 and check that the 3rd high reading (Day 17 in this example) has risen to at least 0.2°C above the cover-line as a re-assuring rise (i.e. in the 4th square or more above the cover line). Mark the rise with 3 little flashes to confirm the rise, as shown on chart on Day 17.
- The Infertile Phase after ovulation by the Temperature Rule begins on the evening of the 3rd raised temperature (Day 17 in this chart) - and continues till the start of the next period, (provided it is double-checked by rules for the Mucus Chart - see later)
The chart finished as a fairly typical 28 day cycle. The period on Day 29 starts a new chart.

- Previous |
- Next |
- Exit Tutorial |
- Help |
- Download as a PDF
© 2007 Fertility Education Trust