guidelines to charting your fertility cycle, page 2 of 26
1. The Temperature Method
We start with the temperature indicator because it is so visual and easy to follow. Although it only indicates the infertile time after ovulation, that phase is absolutely infertile, with the same pregnancy rate as female sterilisation. This is very re-assuring for couples with serious health risks.


Temperature is normal Temperature is raised
Before ovulation, the temperature remains low from the period until ovulation is over. It gives no warning at all of ovulation approaching.
After ovulation, the temperature rises, and remains raised for 10 - 14 days. It drops as the period starts. After 3 high readings, the remainder of the cycle is absolutely infertile.
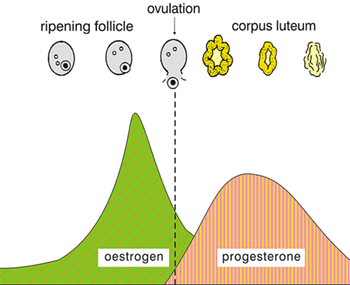
The reason for the rise in temperature is illustrated in the diagram below which shows the two major hormones in a woman’s cycle.
Oestrogen, in the first half of the cycle, which comes from the ripening follicle, has no effect on body temperature.
Progesterone however, which comes from the ruptured follicle (i.e. after ovulation), has “thermogenic properties”, that is, it raises body temperature.
So once the follicle bursts to release its egg, only then does the body temperature begin to rise. After 3 high readings, the rest of the cycle is infertile (see following rules).
- Previous |
- Next |
- Exit Tutorial |
- Help |
- Download as a PDF
© 2007 Fertility Education Trust